At SpeedTrace Pro, we understand that performance profiling shouldn’t compromise your application’s execution speed. Our fast tracing solutions offer:
Selective Instrumentation: Optimize your application's performance without sacrificing critical information. Export performance recording filters directly from your application's scenario trace.
Preinstrumentation: Bypass bothersome just-in-time (JIT) compilation and instrumentation overhead to boost execution speed.
Bug Trapping: Locate, Analyze, Resolve
Software issues often arise in the least expected places, often void of debug or trace info. Our Bug Trapping feature helps you:
Minimize your application's log files
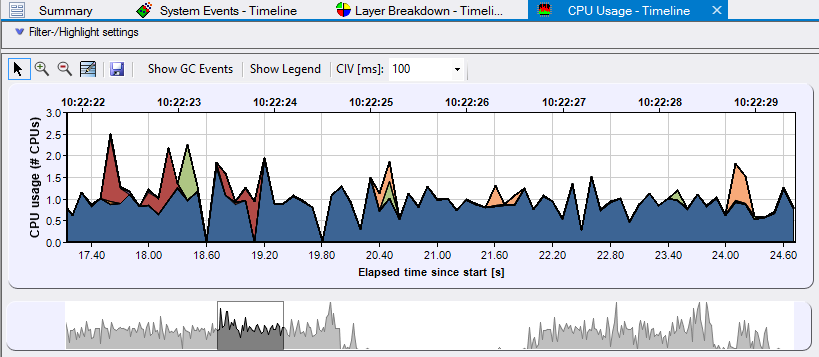
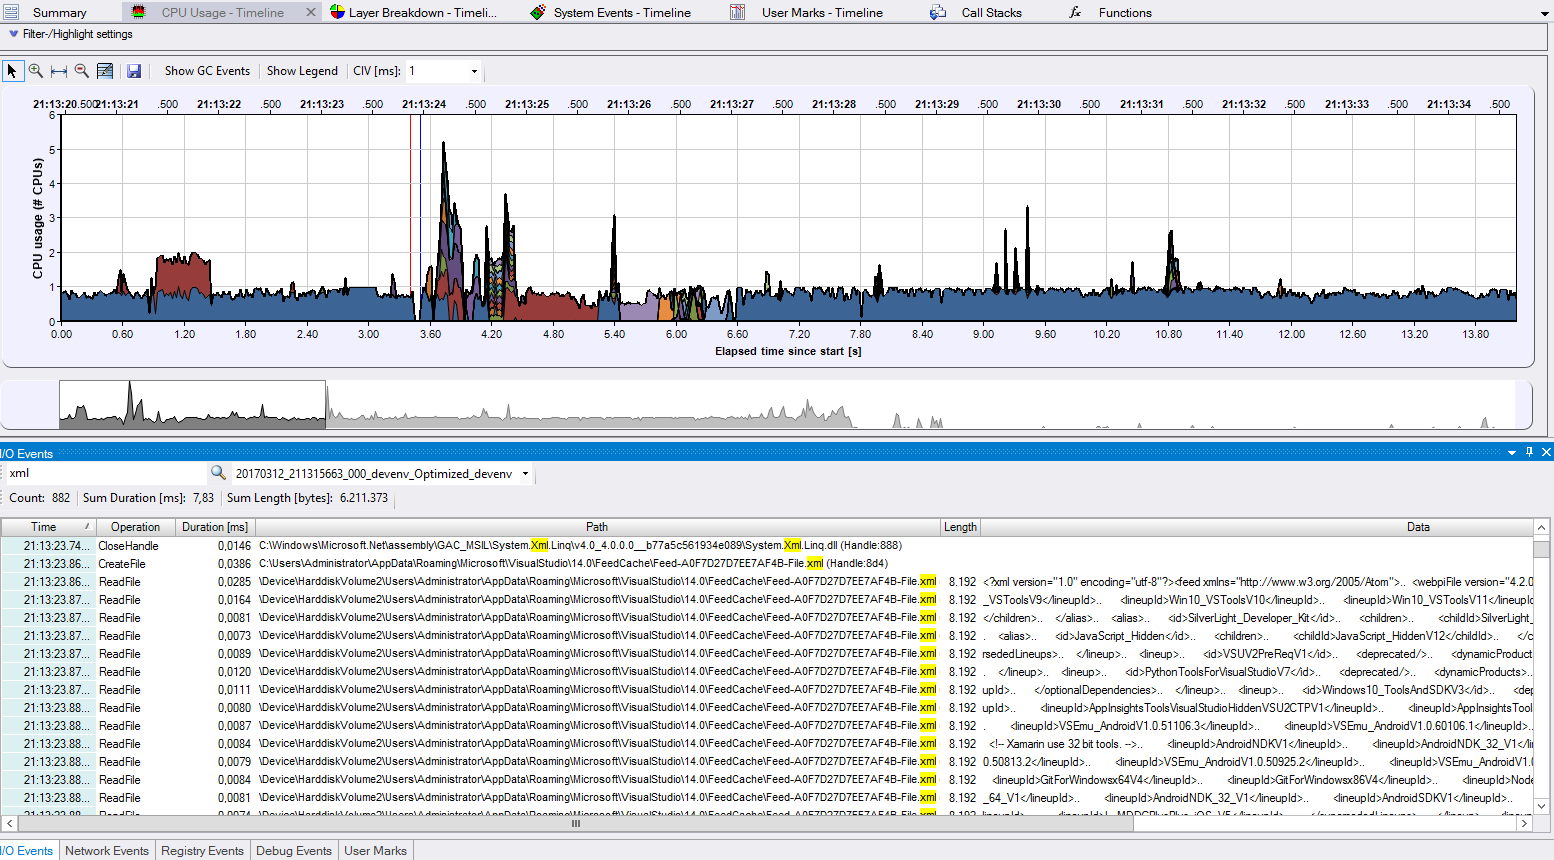
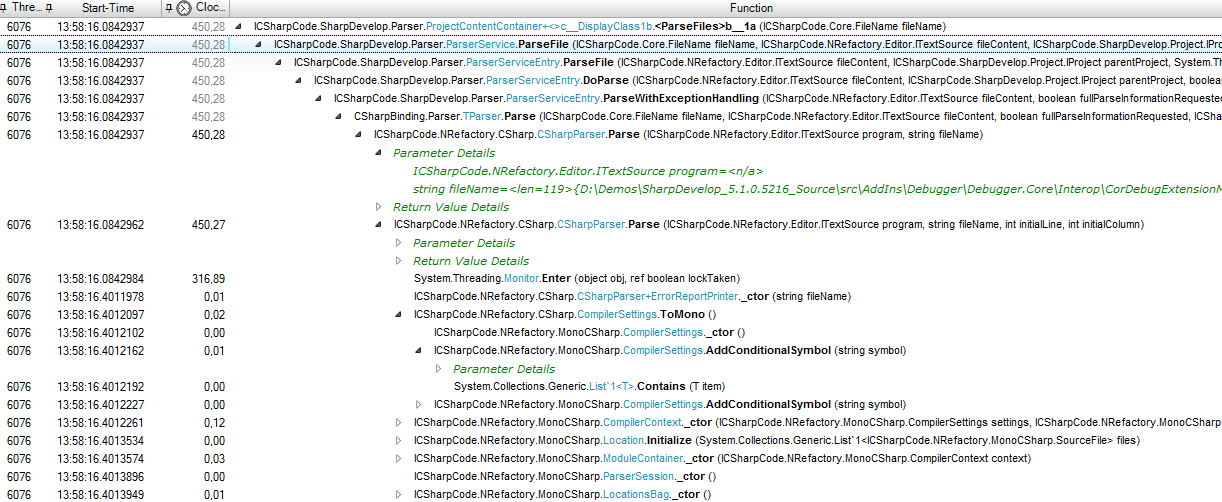
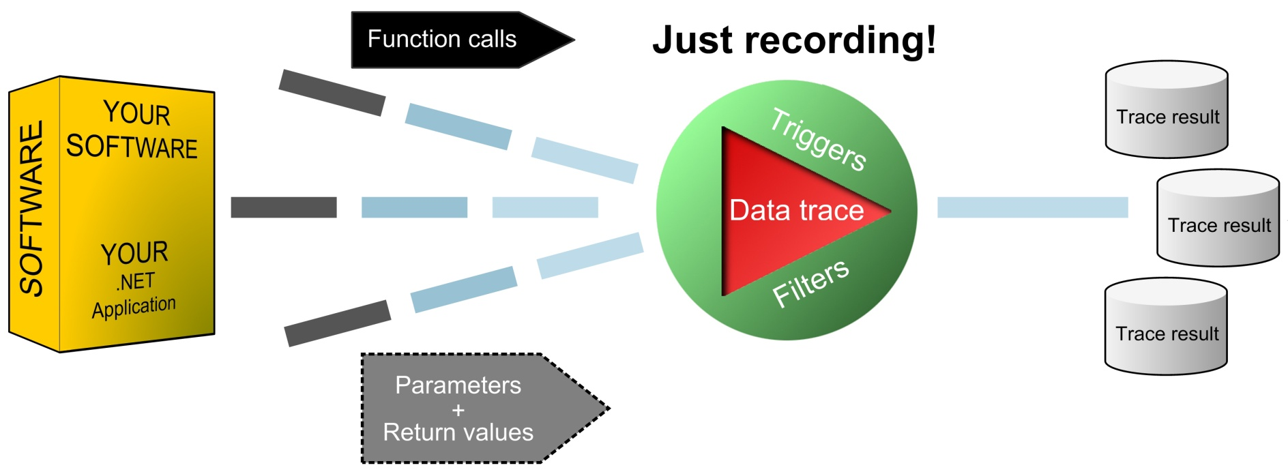
Get application insights directly from your .NET application. SpeedTrace reveals the sequence of executed operations, and you can see recorded app events without manually added trace/debug statements.
Locate and rectify software bugs using the traced application flow. Utilize your logged data for analysis as needed.
Analyze runtime issues, such as application freezes, where event sequence is crucial.
Distributed Tracing: Synchronize and Simplify
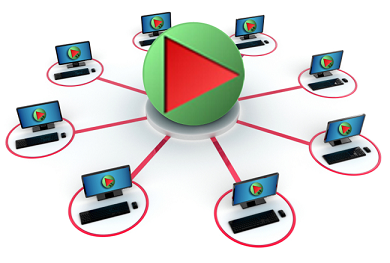
Manage multiple applications or services across various machines with just one SpeedTrace Pro client controller instance. Achieve seamless load balancing and record services (SOA) simultaneously.
SpeedTrace Pro provides you with a freely distributable Recorder that acts as a trace agent. You can trace an unlimited number of external applications simultaneously over the internet/network. Deploy the agents at your customer sites, regardless of network connectivity. This recorder functions like an aviation black box, providing time-stamped events to:
– Understand what happened during an event
– Identify the root cause of the event
Deploy our “Redistributable Recorder Package” on all target machines without the need for additional licensing. Unleash the power of SpeedTrace Pro today!